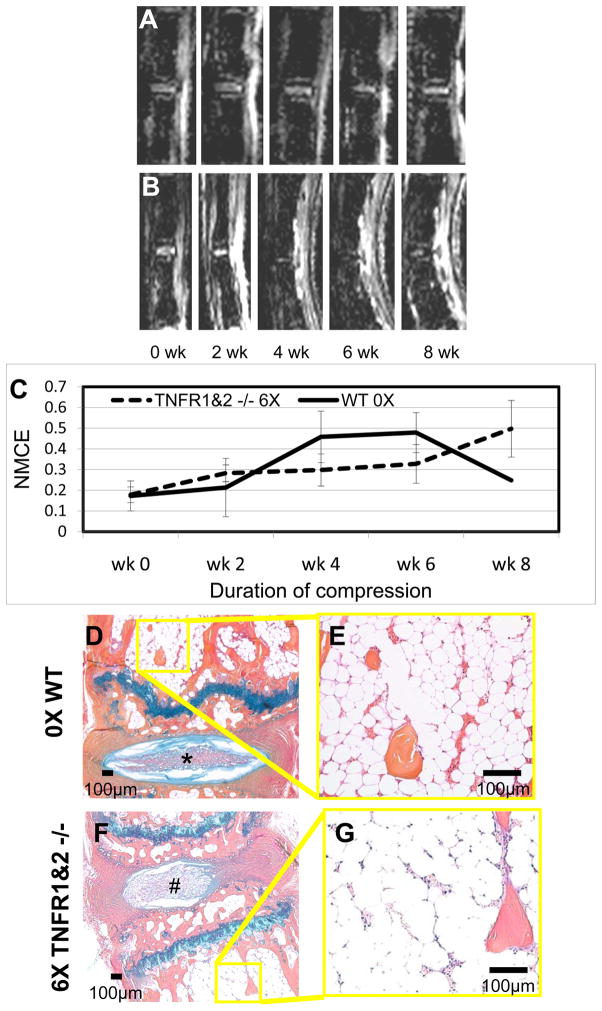
Figure 3. Chronic compression of TNF-receptor knockout at 6X BW fails to induce BME.
Representative longitudinal series of caudal vertebrae post-contrast CE-MRI in 0X BW WT (A) and 6X BW TNFR1&2−/− (B) mice show no increase in signal intensity through 8 weeks of compression. Quantification of NMCE (C) illustrates the intensity changes associated with compression, mean and standard errors (SE) are shown (n=4 tails; 8 vertebrae for each group). Note that neither treatment achieved a NMCE signal at the 0.6 threshold for BME (dotted line) at any time point. Representative AB/OG stained sections of 0X BW WT (D,E) and 6X BW TNFR1&2−/− (F,G) mice at 14 weeks following release of load at 5X magnification (D,F), and 20X magnification (E,G). Note the normal disk in the 0X (*) vs. the herniated disk in the TNFR1&2−/− (#), and the similarities in both vascular sinus area (0X 18.9 ± 3.8% vs. TNFR1&2−/− 14.7 ± 2.0%), and cellularity (0X 1597 ± 684 cell/mm2 vs. TNFR1&2−/− 2490 ± 708 cell/mm2).

