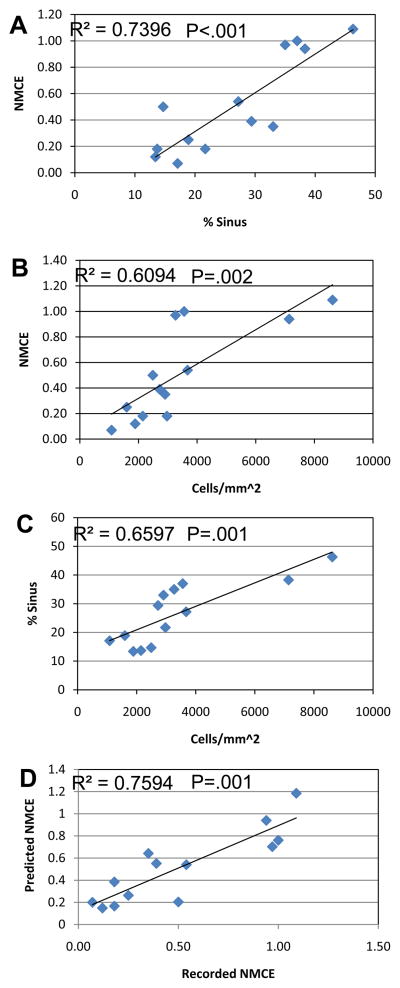
Figure 5. Correlation of marrow vascularity and cellularity with NMCE.
The mean values of the 13 experimental groups in this study were used to estmate linear regression models for NMCE vs. vascularity (% vascular sinus tissue area) (A); NMCE vs. cellularity (B); vascularity vs. cellularity (C); and a multivariate regression model including both vascularity and cellularity as covariates (predicted NMCE) vs. NMCE (D). The significance of these correlations is indicated by their R2 and P values.

