
Figure 4.
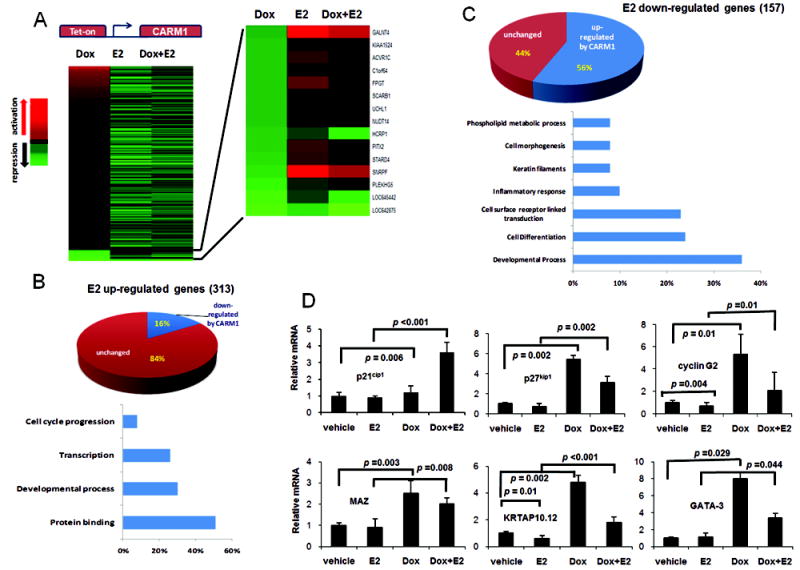
Overexpression of CARM1 modulates E2-dependent gene signature. (A) The ratios of normalized intensities for Dox, E2, or Dox+E2 treated samples vs. that of samples treated with control vehicle (Dox vs DMSO, E2 vs DMSO, and DOX+E2 vs DMSO) were used to demonstrate the activation or repression. Heat map of gene expression calculated as fold changes compared to vehicle indicated that CARM1-induced genes (+Dox) are largely non-overlapping with E2-activated genes. Among CARM1 repressed genes, many are activated by E2 (see blow-up of the heat map), indicating that overexpressing CARM1 can inhibit some E2-activated genes. (B) Pie graphshows that among all E2-upregulated genes, 16% of them are down-regulated by CARM1 overexpression. The bottom of chart shows, among all CARM1-downregualated, E2-upregulated genes, the percentage of genes in each molecular function category.Gene ontology (GO) of the affected genes were determined by GOStat tool online (http://gostat.wehi.edu.au/cgi-bin/goStat.pl),“goa_human” database, where % represent the % of the affected genes that belong to each represented category. (C) Pie graph shows that among all E2 down-regulated genes, 56% of them are up-regulated by CARM1 overexpression. The bottom chart shows, among all CARM1-upregulated, E2-down-regulated genes, the percentage of genes in each molecular function category. (D) Q-RT PCR analyses of p21cip1, p27kip1, cyclin G2, MAZ, KRTAP10.12 and GATA-3 expression in MCF7-tet-on-CARM1. Error bars indicate STDEV from three independent experiments.