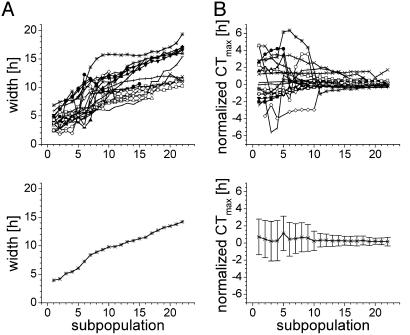
Fig. 3.
Width and phase of neuronal subpopulations. (A)(Upper) The width of neuronal activity patterns of subpopulations in each experiment is plotted on the y axis as a function of the spike amplitude of the recorded population. Subpopulation 1 corresponds with the highest amplitude spikes, which originate from small neuronal populations close to the electrode tip. Smaller amplitude spikes are generated by larger groups of neurons, further away from the tip. Data from a single recording are connected with a line. (Lower) The mean width of the populations is plotted against the spike amplitude of the population. The data illustrate that neurons that are located close to one another (large amplitude spikes) show synchronized activity and render narrow peaks as a result. (B) (Upper) The time of maximal firing rate of each subpopulation from each experiment is plotted and connected with a line. The times are relative to the peak-time in the subpopulation with the smallest spikes. The peak times appeared to vary considerably between subpopulations, and showed large phase jumps (see also Fig. 2). (Lower) The mean and standard deviation of the times of maximum firing are plotted. The standard deviation was larger in the subpopulations with large spikes than in those with small spikes.

