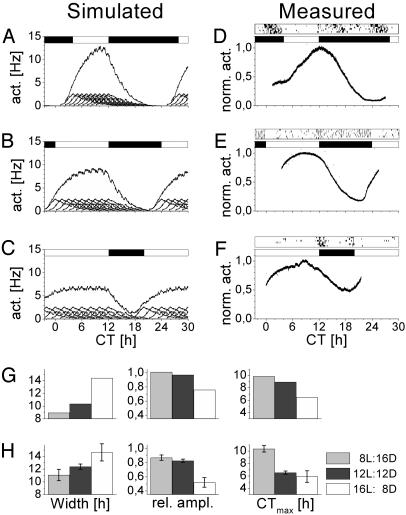
Fig. 7.
Phase differences between neurons contribute to photoperiod adaptation of the SCN. (A–C) Simulated effects of day length on SCN neuronal activity. Simulations were based on the average firing pattern of recorded single units. Nine individual firing patterns are plotted on the abscissa together with the resulting multiunit pattern. (A–C) Simulations of photoperiods L/D 8:16, 12:12, and 16:8, respectively. White bars represent daytime, and black bars represent nighttime. Simulation of a short photoperiod by a small distribution in phase of constituting neurons (A) resulted in a narrow population pattern with a high amplitude rhythm. Simulation of longer photoperiods by larger phase distribution of the neurons (B and C) rendered lower-amplitude rhythms with a broader peak. Maximum firing rate shifts from later to earlier times when day length increases relative to onset of darkness (CT12). (D–G) Measured effects of day length on SCN neuronal activity. (D) Example of neuronal activity pattern recorded in a slice from an animal kept on a short photoperiod. The animal's running wheel actvity pattern in the 6 days preceding slice preparation is indicated above the recording. (E) Example of a recording of an animal kept in a normal photoperiod. (F) Example of a recording from a long photoperiod. Width, relative amplitude, and peak time of the simulated (G) and measured (H) discharge patterns ± SEM are shown (see text for significance).

