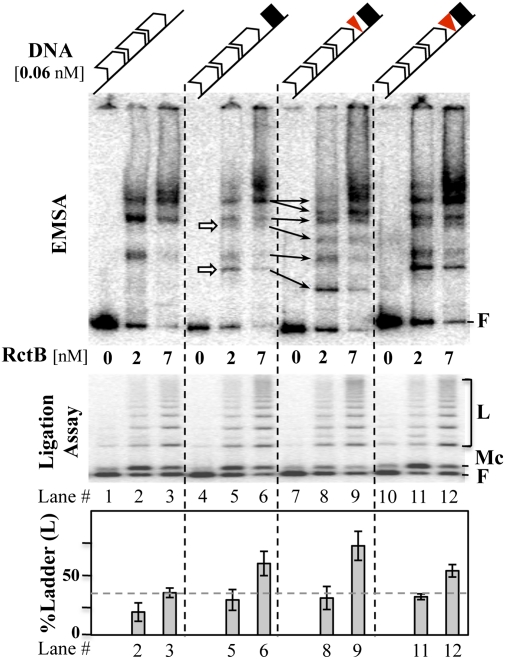
Fig. 4.
EMSA and ligation assay with fragments carrying 3 × 11-mers and the 39-mer. (Upper) Fragments. The symbols are the same as in Fig. 3A. The fragments (Left to Right) were excised from pTVC-248, -255, -256, and 257, respectively, which added 100-bp vector DNA on both flanks. In EMSA (5% PAGE), the white arrows represent some of the new bands that appeared in 39-mer–carrying fragments. The other arrows connecting lanes 7 and 9 most likely represent identically bound species, but migrating differently because of the 5-bp insertion. (Lower) Ligated products of the binding reactions (1.2% agarose). Percent ladder [L, all bands above free (F) DNA and monomer circles (Mc)] was estimated for each lane as the intensity of L compared with the total intensity of DNA after subtracting the background ladder intensity without the initiator (lanes 1, 4, 7, and 10). The gray dotted line in the bar diagram shows the level of ladder formation without the 39-mer (lane 3), so that the increase in the level due to the presence of 39-mer becomes more obvious. The error bars represent one SD and are derived from four different experiments.

