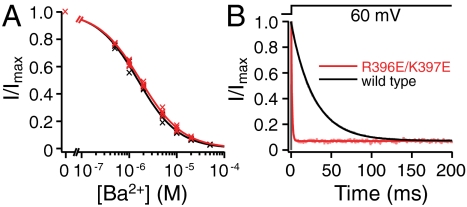
Fig. 3.
Comparison of block by Ba2+ between wild-type and R396E/K397E channels. (A). SK currents were recorded with a 400-ms voltage step to 60 mV from a holding potential of -80 mV. The steady-state current levels with different concentrations of Ba2+ were measured at the end of step or determined using single exponential fits of the current traces, then normalized to the control level in the absence of Ba2+ and plotted as a function of Ba2+ concentration. Data from four patches for wild-type (black crosses) and four patches for R396E/K397E channels (red crosses) were individually fitted with the Hill equation (individual fits not depicted): I/Imax = 1/[1 + ([Ba2+]/IC50)h], where IC50 is the half-block Ba2+ concentration, and h is the Hill coefficient. Average IC50 and h values are reflected by the solid lines for wild-type (black) and R396E/K397E channels (red). (B) SK currents were recorded in the presence of 20 μM Ba2+ with a voltage step to 60 mV from a holding potential of -80 mV. Currents are normalized to the peak values at the beginning of the voltage step. Current traces are fitted with single exponential time courses (solid lines). Rates of relaxation from the fits in this figure are 1/τ = 35.2 s-1 (wild type, black line), and 1/τ = 1,029.1 s-1 (R396E/K397E, red line). Average results from similar experiments are 1/τ = 35.3 ± 3.6 s-1 (wild type, n = 4), and 1/τ = 1,064.8 ± 69.4 s-1 (R396E/K397E, n = 4).

