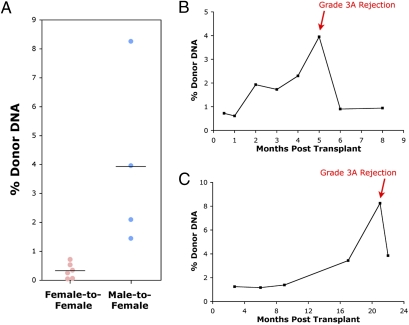
Fig. 2.
Donor DNA levels determined by digital PCR using a chromosome Y marker. (A) Ten plasma samples from patients with biopsy-determined rejection events with grade ≥3A–2R were analyzed, including six female patients (1–6) receiving female organs (six total events) and three female patients (7–9) receiving male organs (four total events). Group averages are marked by black lines. (B and C) Time-course graphs of chromosome Y levels (% donor DNA) in patients 7 (B) and 8 (C). Both patients had grade 3A–2R rejections as determined by biopsy at the indicated time point.

