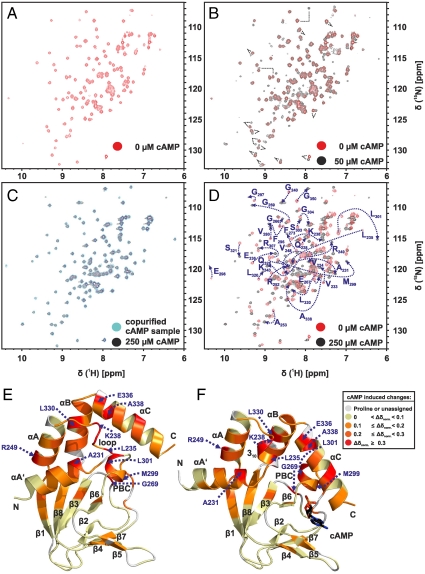
Fig. 3.
Titration of cAMP-free CNBD with cAMP. (A) 2D (15N - 1H)-HSQC spectrum of 0.2 mM cAMP-free [U - 15N]-labeled CNBD (T = 25 °C, 10 mM Tris/HCl, pH 7, 100 mM sodium chloride, 0.2 mM EDTA, 0.02% (w/v) sodium azide, 5% (v/v)  ). (B) 2D (15N - 1H)-HSQC spectrum recorded in the presence of 50 μM cAMP. A second set of NMR signals emerged that originate from CNBD that has bound to cAMP. Two resonance signals characteristic for some amides are highlighted by brackets. Resonance signals of the cAMP-free CNBD spectrum are shown in red. (C) 2D (15N - 1H)-HSQC spectrum recorded in the presence of 250 μM cAMP. NMR signals originating from cAMP-free CNBD disappeared, proving that all CNBD protein has bound to cAMP. The spectrum is indistinguishable from spectra that were recorded using samples where cAMP copurified with CNBD (shown in blue) and that were reported previously (18). (D) Chemical-shift differences of resonance signals between cAMP-free and -bound CNBD; the most pronounced perturbations are highlighted by blue arrows. The chemical-shift differences were mapped on ribbon diagrams of the cAMP-free (E) and cAMP-bound (F) solution structures. cAMP-induced changes in both spectrum dimensions (
 and 15N) were classified according to the following equation:
  . The cAMP molecule is shown in stick representation.

