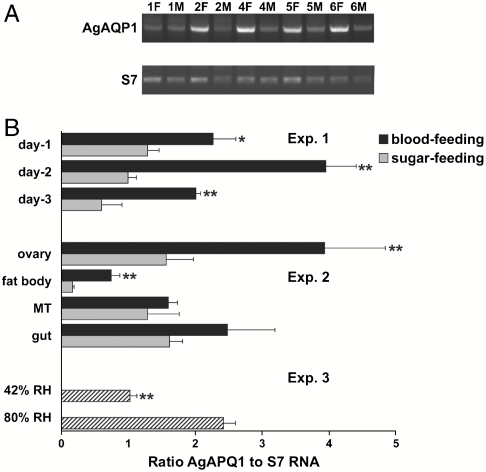
Fig. 3.
Expression profiles of AgAQP1 in vivo. (A) Expression levels of AgAQP1 at different development stages were determined by semiquantitative RT-PCR. The female or male adults were 1-, 2-, 4-, 5-, or 6-d old postemergence. The upper gel shows AgAQP1 specific amplification, and the lower gel shows the amplification of the single-copy S7 control gene. (B, Exp. 1) Ratio AgAQP1 to S7 RNA on 1-, 2-, and 3-d post– blood feeding or sugar feeding in 6-d old adults determined by real-time quantitative RT-PCR. (B, Exp. 2) Ratio AgAQP1 to S7 RNA in ovary, fat body, Malpighian tubules, and gut on day 2 post–blood feeding by quantitative real-time RT-PCR. * P < 0.05; ** P < 0.02. (B, Exp. 3) Ratio AgAQP1 to S7 RNA at 42% vs. 80% relative humidity in whole female adults determined by quantitative real-time RT-PCR. ** P < 0.02.

