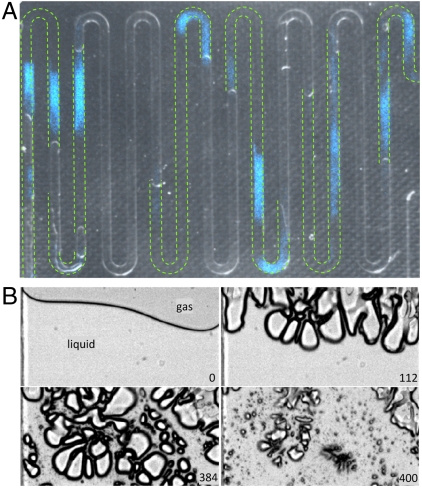
Fig. 2.
Luminol chemiluminescence from cavitation bubbles. (A) Composed picture of the channel geometry (gray background) showing the distribution of liquid and gas phases. The green dashed lines indicate the positions of liquid slugs just before the ultrasound is switched on. The bluish patches are taken with an intensified EMCCD camera and capture the chemiluminescence from the oxidation of luminol. (B) Sequence of images taken with a high-speed recording of the bubble distribution near a gas–liquid interface. The number in each frame is the time in microseconds after turning on the ultrasound. They show consecutively the initial gas–liquid interface leading to the severe surface instabilities, large bubble expansions, and finally the collapses. The interface was exposed to a harmonic driving at an amplitude of 230 V at its resonance frequency of 103.6 kHz. The width of each frame (channel) is 500 μm.

