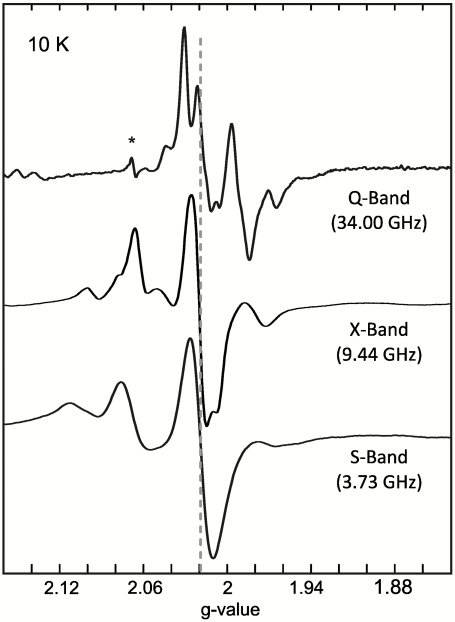
Fig. 2.
EPR spectra of the [FeS] clusters in the as-isolated state of Hase I (pH 7.4) at S-band (cw), X-band (cw), and Q-Band (pulse) frequencies at T = 10 K. The asterisk marks a cavity impurity. The dashed line denotes the position of the [3Fe4S]1+ signal. Experimental Conditions: Modulation amplitude 0.3 mT and 1 mT; mw power 6 mW and 2 mW for S- and X-band, respectively.

