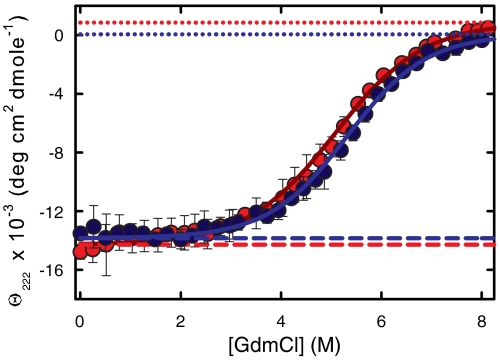
Fig. 4.
Equilibrium unfolding curves. (A) Comparison of denaturant unfolding curves for Cys-HP35(Nle24,Nle29) and Cys-HP35(Nle24,His27,Nle29). Equilibrium CD data collected at 10 °C (20 mM sodium acetate, 1 mm Tris(2-carboxyethyl)phosphine (TCEP), 75 μm protein, pH = 4.9) as a function of GdmCl concentration. The experimentally measured ellipticities are the dark-blue points [Cys-HP35(Nle24,Nle29)] and the red points [Cys-HP35(Nle24,His27,Nle29)]. The blue and red solid lines are the two-state fits to the data. The dashed lines are the native baselines and the dotted lines are the unfolded baselines. The denaturation midpoint concentrations, [D]mid, are 5.1( ± 0.2)M for Cys-HP35(Nle24,His27,Nle29) and 5.3( ± 0.1)M for Cys-HP35(Nle24,Nle29), whereas the m-values are 640 (+149,-112) cal mol-1 M-1 for Cys-HP35(Nle24,His27,Nle29) and 714(+88, -62) cal mol-1 M-1 for Cys-HP35(Nle24,Nle29). The error bars represent standard deviations from the average of at least three measurements on separately prepared solutions.

