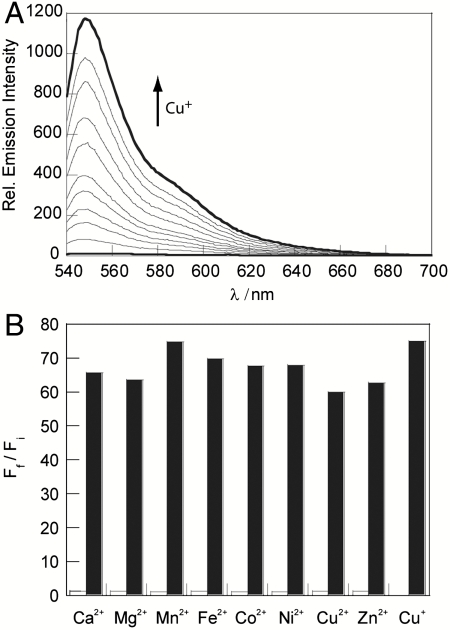
Fig. 2.
Spectroscopic responses and selectivity of CS3. All spectra were acquired in 20 mM HEPES, pH 7, at 25 °C. (A) Fluorescence response of 4 μM CS3 to Cu+. Spectra shown are for buffered [Cu+] of 0, 0.3, 0.5, 0.8, 1.0, 1.5, 2.0, 2.5, 3.0, 3.5, and 4.0 μM. (B) Fluorescence responses of CS3 to various metal ions. Bars represent the final integrated fluorescence response (Ff) over the initial integrated emission (Fi). White bars represent the addition of an excess of the appropriate metal ion (2 mM for Ca2+, Mg2+, and Zn2+; 50 μM for all other cations) to a 4 μM solution of CS3. Black bars represent the subsequent addition of 4 μM Cu+ to the solution. Excitation was provided at 530 nm, and the collected emission was integrated over 540 to 700 nm.

