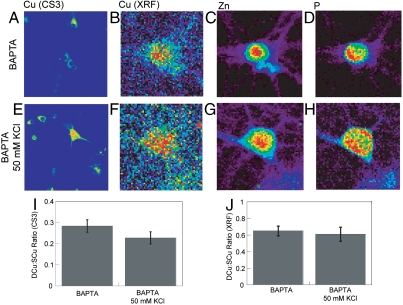
Fig. 5.
(A) Rat hippocampal neurons treated with ECS buffer for 2 min with 10 μM BAPTA-AM and then stained with 2 μM CS3 for 10 min. (B–D) Rat hippocampal neurons treated with ECS buffer with 10 μM BAPTA-AM for 2 min and then fixed with 4% PFA and imaged by XRFM. Images shown are for (B) Cu, (C) Zn, and (D) P channels. (E) Live primary rat hippocampal neurons treated with 50 mM KCl in ECS buffer with 10 μM BAPTA-AM for 2 min and then stained with 2 μM CS3 for 10 min. (F–H) Rat hippocampal neurons treated with 50 mM KCl in ECS buffer with 10 μM BAPTA-AM for 2 min and then fixed with 4% PFA and imaged by XRFM. Images shown are for (F) Cu, (G) Zn and (H) P channels. (I) Graph showing the blinded quantification of CS3-derived dendrite:soma fluorescence ratios for BAPTA-AM–treated (n = 22) and BAPTA-AM/KCl–treated (n = 16) neurons. Error bars represent SEM. (J) Graph showing the XRF dendrite:soma fluorescence ratios for resting and depolarized BAPTA-AM–treated neurons. Error bars represent SEM.

