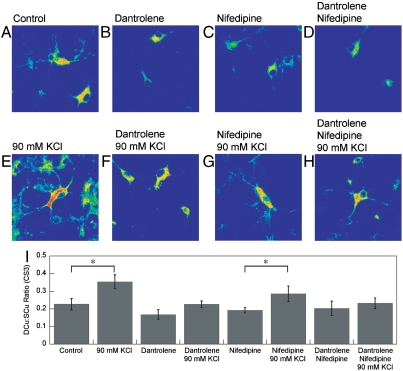
Fig. 6.
Molecular imaging of Cu distributions in resting, depolarized, and inhibitor-treated rat hippocampal neurons with CS3. (A) Live primary rat hippocampal neurons treated with ECS buffer for 10 min, (B) treated with ECS buffer with 30 μM dantrolene for 10 min, (C) treated with ECS buffer with 100 μM nifedipine for 10 min, (D) treated with ECS buffer with 30 μM dantrolene and 100 μM nifedipine for 10 min, (E) treated with 90 mM KCl in ECS buffer for 2 min, (F) treated with 30 μM dantrolene in ECS buffer for 10 min and then 90 mM KCl in ECS buffer for 2 min, (G) treated with 100 μM nifedipine in ECS buffer for 10 min and then 90 mM KCl in ECS buffer for 2 min, and (H) treated with 30 μM nifedipine and 100 μM dantrolene in ECS buffer for 10 min and then 90 mM KCl in ECS buffer for 2 min and then stained with 2 μM CS3 for 10 min. (I) Graph showing the blinded quantification of CS3-derived dendrite:soma fluorescence ratios for resting, depolarized, and inhibitor-treated neurons (n≥11). Error bars respresent the SEM. Asterisk (*) indicates P < 0.05.

