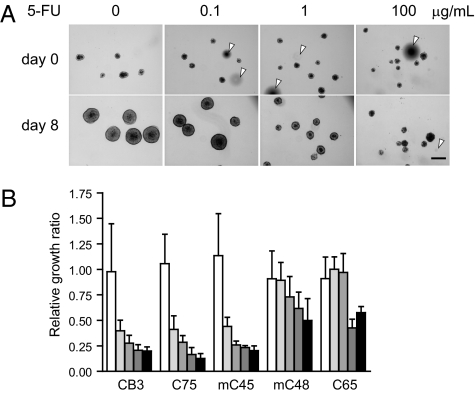
Fig. 6.
Response of CTOSs to a chemotherapeutic drug. (A) CTOSs of mC45 were treated as indicated. Arrowheads indicate air bubbles. (Scale bar: 100 μm.) (B) The sensitivity of CTOSs from five patients to 0.1, 0.5, 1.0, 5.0, and 10 μg/mL 5-FU (Left to Right). Values are relative growth ratios compared with 0.1% DMSO-treated control CTOSs; n = 10/group.

