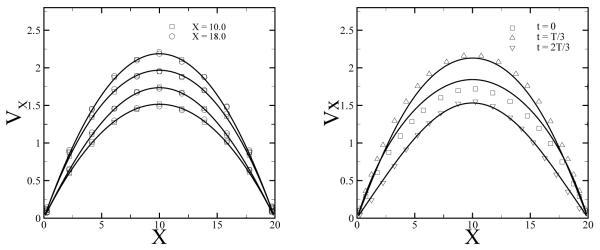
Fig. 16.
The velocity profiles extracted from the Womersley flow with Ω = 2π/200 (left) and Ω = 2π/50 (right). Left: the solid lines, from top to bottom, represent the theoretical predictions at t = T/4, 0, 2T/4 and 3T/4. The square and circle symbols represent the numerical results extracted at x = 10 and x = 18. Right: the solid lines, from top to bottom, represent the theoretical predictions at t = T/3, 0, 2T/3, the symbols represent the DPD results extracted at x = 10.

