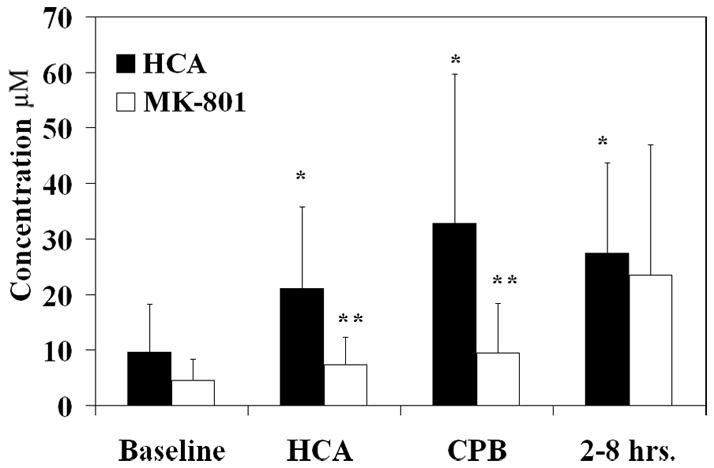
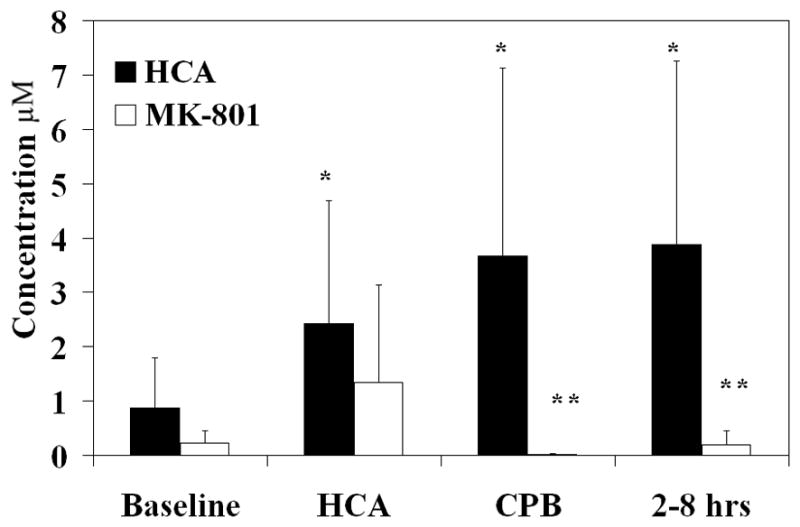
Figure 1.


Intracerebral glutamate levels (μM) over time with and without MK-801 treatment (figure 1A). Intracerebral glycine levels (μM) (figure 1B) and intracerebral citrulline levels (μM) (figure 1C) over time with and without MK-801 treatment. *, p<0.05 compared to baseline. **, p<0.05 compared to HCA without MK-801 treatment.
