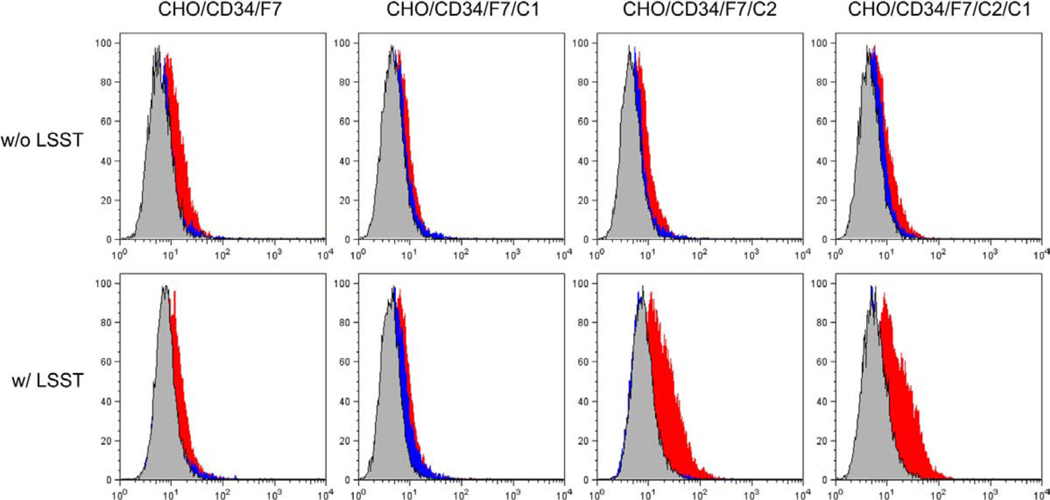
Figure 6.
L-selectin•IgM chimera binding assay of CHO cell lines. CHO cell lines listed in Table 1 were tested. The L-selectin•IgM chimera most robustly binds to the CHO/CD34/F7/C2/LSST and CHO/CD34/F7/C2/C1/LSST lines at almost equivalent levels. The remaining lines show only marginal L-selectin•IgM binding. Red histograms represent L-selectin•IgM chimera bindings. Blue and gray histograms indicate control experiments using cells treated with sialidase and EDTA, respectively.

