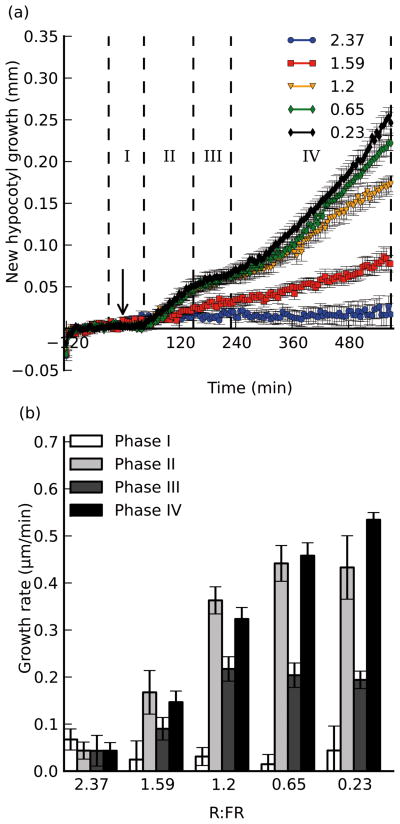
Figure 1. The magnitude of the growth response is inversely correlated with the R:FR ratio.
Seedlings were exposed to varying intensities of supplemental FR light, and imaged for 2 hours before and 9.5 hours after exposure. a), new hypocotyl growth observed for seedlings exposed to supplemental FR light such that the R:FR ratio became 0.23 (black), 0.65 (green), 1.2 (orange), 1.59 (red) or 2.37 (blue; control). Arrow indicates time of treatment (t=0). Dotted lines and roman numerals indicate phases of growth with which growth rates are calculated in b). b), growth rates calculated over selected time periods to reflect the different stages of growth. Error bars indicate ±s.e.m for at least 8 replicates in each assay.

