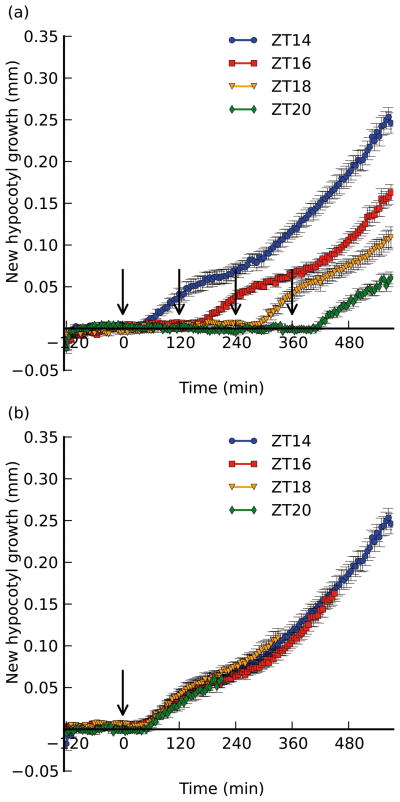
Figure 2. Shifting the time of shade treatment has no effect on the shape or magnitude of the growth response.
Col-0 seedlings were maintained in the same conditions as before (see Fig. 1), but were kept in high R:FR for 2, 4, or 6 hours longer than the original assay (treated with shade at ZT16, 18, or 20, respectively). Shown for reference is the ZT14 assay as described in Fig. 1. a) Growth responses normalized to time of transfer to the imaging platform. Treatment times are indicated by arrows (drawn at 0 min for ZT14, 120 min for ZT16, 240 min for ZT18, and 360 min for ZT20). b) curves normalized to time of treatment (indicated by the arrow). Data was truncated for length measured prior to 120 min. before treatment. Error bars indicate ±s.e.m. for at least 6 replicates.

