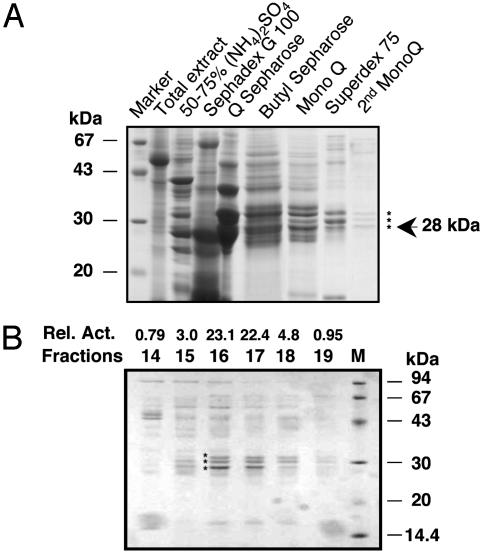
Fig. 1.
Protein profiles from the purification of tobacco SABP2. (A) SDS/PAGE analysis of fractions from each step of the SABP2 purification protocol. Aliquots from pooled fractions containing peak SA-binding activity were analyzed by SDS/PAGE on a 12.5% gel that was subsequently stained with Coomassie blue. After the final Mono Q chromatography step, three proteins (indicated by *) copurifed with the SA-binding activity. An arrow marks the putative SABP2 protein, which is 28 kDa. (B) Protein profiles and SA-binding activity in fractions from the final Mono Q chromatography step. SA-binding activity (dpm, ×1,000) is shown above each fraction. The three proteins copurifying with the SA-binding activity are marked by *.

