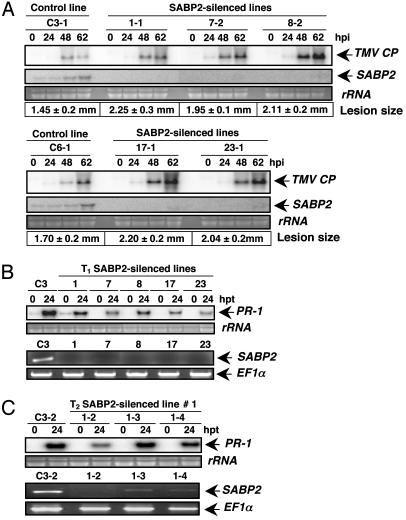
Fig. 4.
Silencing of SABP2 suppresses local resistance to TMV and SA-induced PR-1 expression. (A) RNA blot analysis of TMV CP and SABP2 transcript accumulation in control plants (transformed with empty vector) and various SABP2-silenced lines from the T2 generation. Total RNA was isolated from TMV-inoculated leaves harvested at the indicated time points. After transfer, the membrane was hybridized with probes for the SABP2 and TMV CP. The size of TMV-induced lesions presented is an average of 50 lesions per line. Lesion diameter is presented ± standard deviation. (B) Comparison of SA-induced PR-1 expression and SABP2 silencing in the T1 generations of control and SABP2-silenced lines. Total RNA was isolated from all lines at 0 and 24 h posttreatment (hpt) with 0.25 mM SA. PR-1 expression was monitored by RNA blot analysis, whereas SABP2 expression was determined by RT-PCR analysis by using cDNA generated from untreated plants. The level of EF1α product was monitored as an internal control to normalize the amount of cDNA template. Please note that PR-1 induction by SA was tested at least twice in two independent experiments for both the T1 and T2 generations to confirm the difference in SA responsiveness. (C) Comparison of SA-induced PR-1 expression and SABP2 silencing in three different T2 generation plants for line 1; see B for details.

