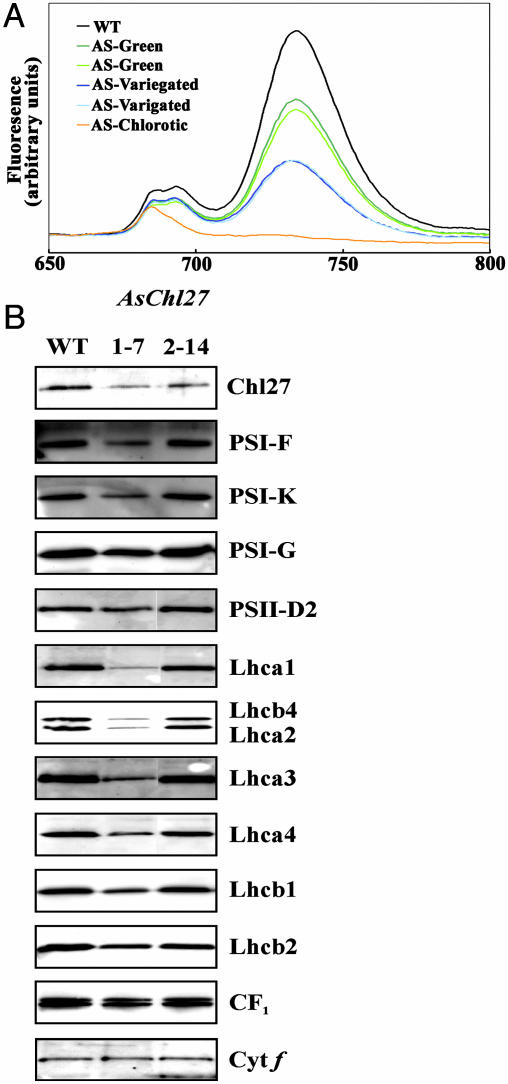
Fig. 5.
Reduced Chl protein abundance in chl27-as plants. (A) Fluorescence emissions (77 K) measured from 650 to 800 nm from WT (black), antisense lines showing no visible phenotype [green (chl27-as2.22.1) and light green (chl27-as2.22.6)], variegated lines [blue (chl27-as2.22.10) and light blue (chl27-as2.22.12)], and chlorotic [orange (chl27-as1.7.5)] plants. (B) Immunoblot analysis of CHL27-deficient and WT plants. Thylakoid membranes isolated from lines 2–14 (mild variegation) and 1–7 (more severe variegation) were analyzed for the abundance of the indicated thylakoid membrane protein. Each lane was loaded with 3 μg of protein.

