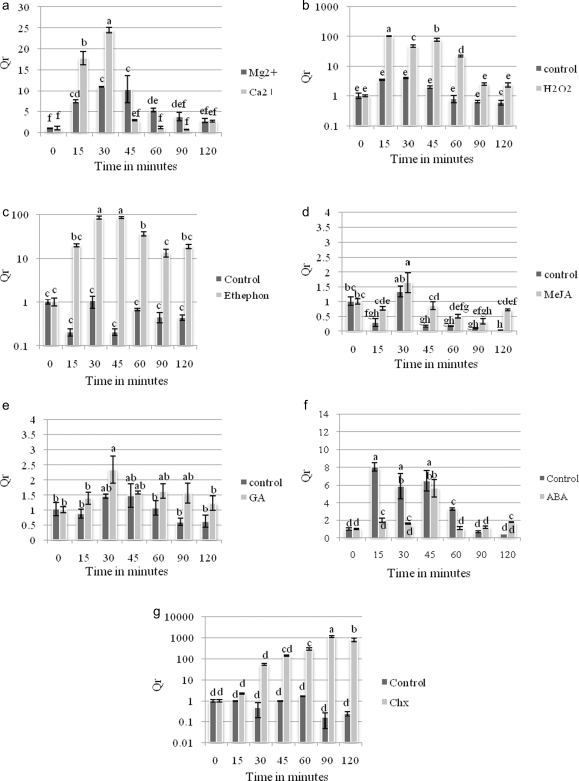
Figure 5.
Time course accumulation of PtaZFP1 transcripts after different treatments of P. tremula × P. alba cells cultures. (a) Calcium 10 mM (Ca2+; magnesium was used as osmotic control, Mg2+), (b) Hydrogen peroxide 500 µM (H2O2), (c) Ethephon 1 mM, (d) MeJA 100 µM, (e) GA 100 µM, (f) ABA 100 µM and (g) Chx 50 µM. Total RNAs were extracted at different times (0, 15, 30, 45, 60, 90 and 120 min). The accumulation of relative transcripts (Qr) was determined by real-time quantitative PCR and it corresponds to the mean values of three independent experiments ± SE. Significant differences (P < 0.05) of responses between different times or treatment are indicated by different letters (Tukey's HSD test). For a better understanding, a semi-logarithmic scale has been used for b, c and g.

