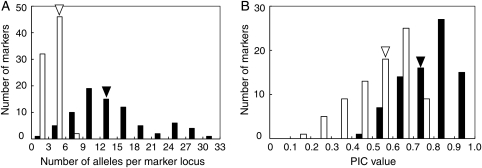
Figure 3.
Distribution of allele numbers (A) and PIC values (B) for 80 SSR marker loci in 87 soybean cultivars or wild accessions as determined by multiplex PCR and a fluorescence-based sequencer in the present study (solid bars) or by singleplex PCR and 3% agarose gel electrophoresis in a previous study12 (open bars). Arrowheads indicate the corresponding averages for allele number and PIC value determined by the two methods.

