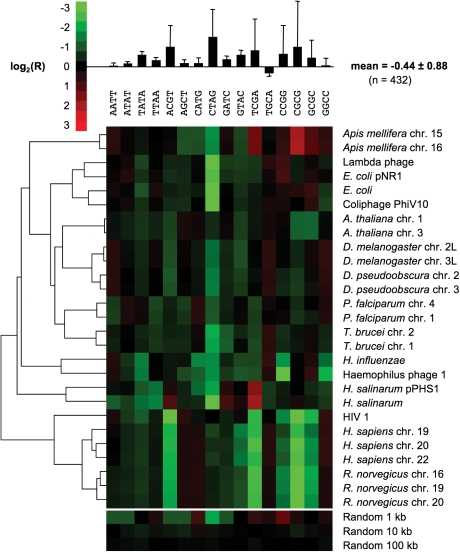
Figure 2.
Examples of palindrome frequency patterns. Frequency of the 16 palindromes of length 4 in selected genomes, expressed as log2 of ratio (R) of actual to expected occurrence. Hierarchical clustering was performed based on the city-block distance.23 (Top) Mean and variance by palindrome. (Bottom) The signals from three random sequences are shown for comparison.

