
Figure 2. Comparative assessment of deletion discovery methods.
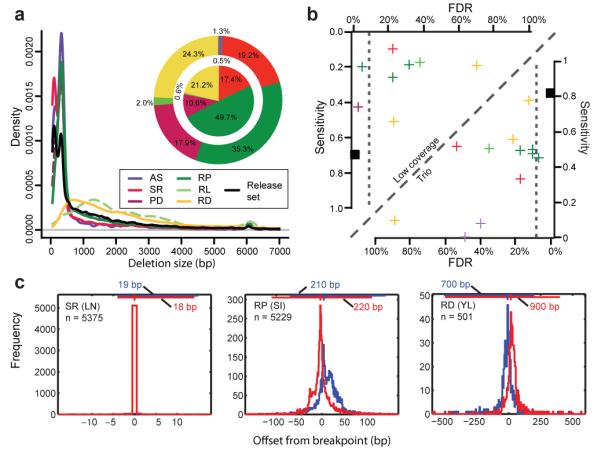
A. Deletion size-range ascertained by different modes of SV discovery. Three groups are visible, with AS and SR, PD and RP, as well as RD and ‘RL’ (RP analysis involving relatively long range (≥1 kb) insert size libraries, resulting in a different deletion detection size range compared to the predominantly used <500kb insert size libraries), respectively, ascertaining similar size-ranges. Pie charts display the contribution of different SV discovery modes to the release set. Outer pie = based on number of SV calls; inner pie = based on total number of variable nucleotides. Of note, not all approaches were applied across all individuals (see Supplementary Table 2). B. Sensitivity and FDR estimates for individual deletion discovery methods based on gold standard sets for individuals sequenced at high (NA12878) and low-coverage (NA12156), respectively. All depicted estimates are summarized in Supplementary Tables 3, 4, 6. Vertical dotted lines correspond to the specificity threshold (FDR≤10%). C. Breakpoint mapping resolution of three deletion discovery methods (the respective method names are in Supplementary Table 2). The blue and red histograms are the breakpoint residuals for predicted deletion start and end coordinates, respectively, relative to assembled coordinates (here assessed in low-coverage data). The horizontal lines at the top of each plot mark the 98% confidence intervals (labeled for each panel), with vertical notches indicating the positions of the most probable breakpoint (the distribution mode).