
Figure 4. Contribution of SV formation mechanisms to the SV size spectrum.
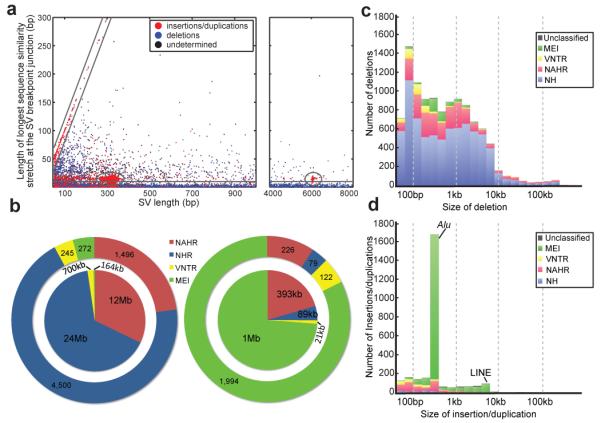
A. Breakpoint junction homology/microhomology length plotted as a function of SV size for SVs originally identified as deletions compared to a human reference. Dots are colored according to the SVs’ classification as deletions, insertions/duplications, or “undetermined” relative to inferred ancestral genomic loci. Gray lines mark groups of SVs likely formed by a common formation mechanism. The diagonal highlights tandem duplications (and few reciprocal deletion events), in which the length of the duplicated sequence correlates linearly with the length of the longest breakpoint junction sequence identity stretch. The ellipses indicate MEIs, i.e., Alu (~300 bp) and L1 (~6 kb) insertions, associated with target site duplications of up to 28 bp in size at the breakpoints. The horizontal group corresponds mostly to NH-associated deletions with <10 bp microhomology at the breakpoints. The remaining (ungrouped) SVs comprise truncated MEIs, VNTR expansion and shrinkage events, as well as NAHR-associated deletions and duplications. B. Relative contributions of SV formation mechanisms in the genome. Numbers of SVs are displayed on the outer pie chart and affected base pairs on the inner. Left panel: SVs classified as deletions relative to ancestral loci. Right panel: SVs classified as insertions/duplications. C. Size spectra of deletions classified relative to ancestral loci. D. Size spectra of insertions/duplications.