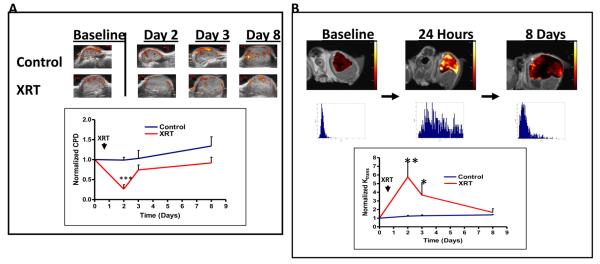
Figure 4.
A) Serial color power Doppler imaging of a representative #4C6 xenograft demonstrates transient loss of central and peripheral tumor vascular flow by 24 hours post-radiation, followed by early stromal vessel recovery 48 hours post-treatment. Statistical comparisons of pooled results at each posttreatment timepoint are with baseline pretreatment values; ***, p < 0.001. B) Serial single-tracer DCE-MRI mapping of volume transfer constant (Ktrans) values in a representative #4C6 xenograft demonstrates increased Ktrans values by 24 hours post-radiation, consistent with loss of vascular integrity. Corresponding Ktrans value distribution histograms are shown below each image. Ktrans values normalize towards baseline values by 7 days post-treatment. Statistical comparisons of pooled results at each timepoint are with baseline findings, as reported as mean values +/− s.d; *, p < 0.05; **, p < 0.005.

