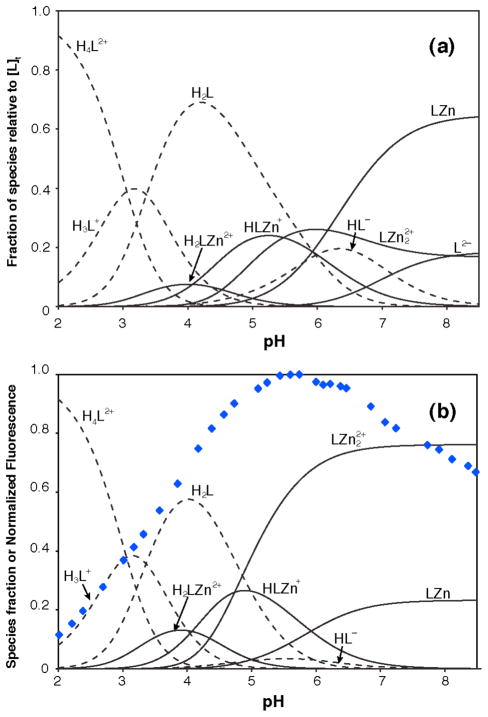
Figure 6.
Calculated speciation plots as a function of pH in the range 2–8.5 for (a) an aqueous solution containing 1 μM ZPP1 and 1 μM ZnCl2, and (b) an aqueous solution containing 1 μM ZPP1 and 2 μM ZnCl2. Overlaid in (b), blue diamonds, is the fluorescence emission of a solution containing 1 μM ZPP1, 2 μM ZnCl2, and 100 mM KCl as a function of pH.

