
Figure 8.
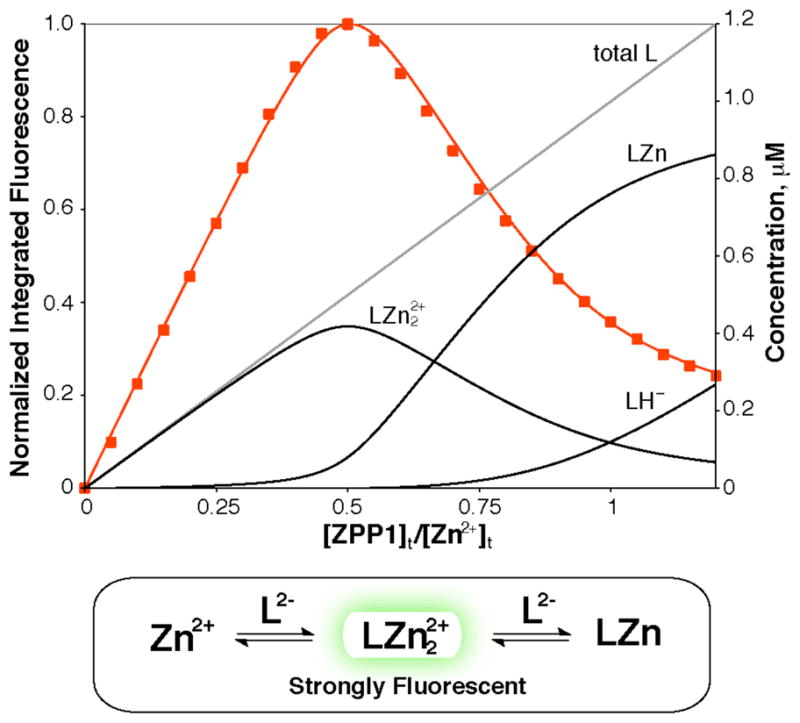
Species distribution diagram for a fluorescence titration of 1.0 μM Zn2+ in aqueous buffer at pH 7.0, treated with incremental additions of ZPP1 sensor. Overlaid is the observed corrected fluorescence F′ (red squares) and the theoretical corrected fluorescence (red solid line), calculated based on contributions of the individual species to the overall fluorescence emission. The theoretical corrected fluorescence was calculated as , using the proportionality constants previously determined from the fit of the binding isotherm.