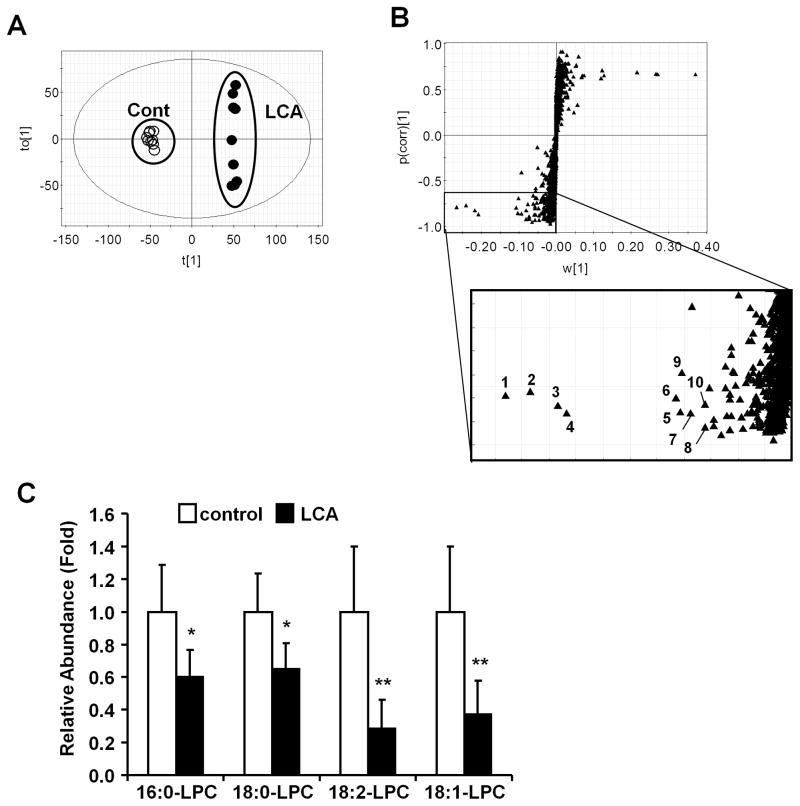
Figure 1. Identification of ions changed by LCA exposure.
(A) OPLS analysis of the serum metabolome between control diet (open diamond) and LCA diet (closed diamond). (B) S-plot analysis following the OPLS analysis. Number indicates a ranking determined by contribution analysis based on the OPLS analysis. (C) Relative abundance of serum LPC. Amounts were normalized to the internal standard 1-stearoyl (D35)-2-hydroxy-sn-glycero-3-phosphocholine. The value was expressed as fold to the mean of control. Data represents the mean and SD (n=6–7). Significance was determined with unpaired t test (*, P<0.05; **, P<0.01).

