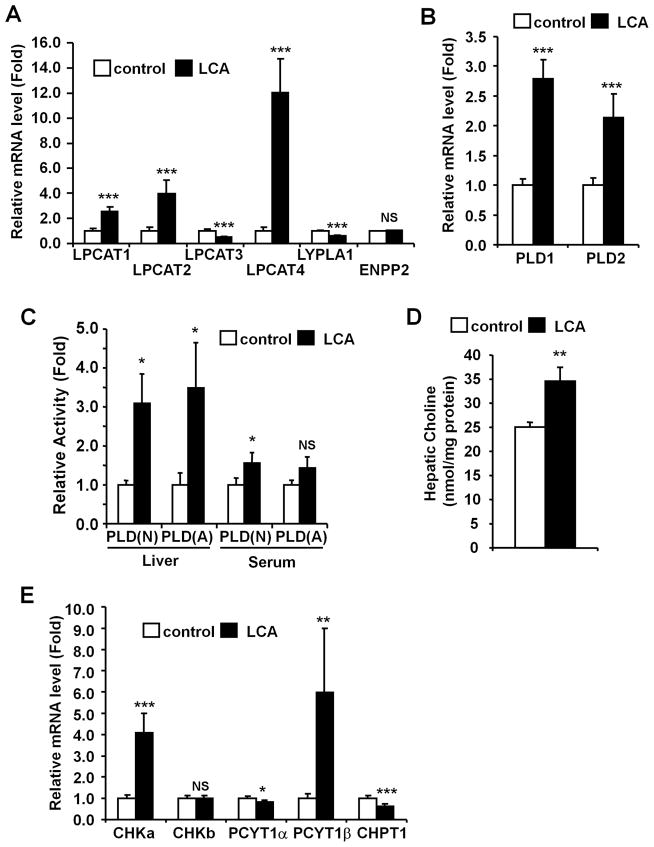
Figure 3. LCA exposure alters hepatic phospholipid metabolism.
qPCR analysis of mRNAs encoding LPC metabolism-related genes (A) and PLD (B). Expression was normalized to 18S ribosomal RNA and each bar represents the mean value and SD (n=5–6). (C) Serum and liver PLD activities were determined and the values expressed as fold to the mean of control activity. Data represents the mean and SD (n=3–4). N and A denotes neutral and acidic conditions, respectively. (D) Hepatic choline levels were normalized to protein amounts of whole extract. Data represents the mean and SD (n=4–5). (E) qPCR analysis of mRNAs encoding PC synthesis-related genes. Expression was normalized to 18S ribosomal RNA and each bar represents the mean value and SD (n=5–6). Significance was determined with unpaired t test (*, P<0.05; **P<0.01; ***, P<0.001). NS, no significance.

