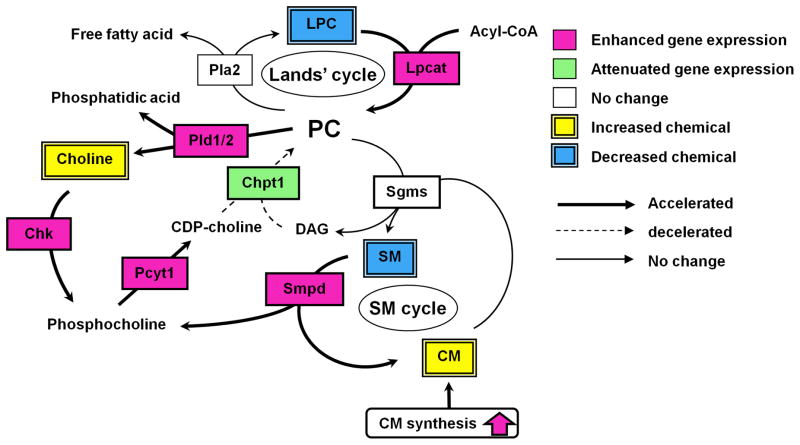
Figure 7. LCA-induced alteration of phospholipid/shingolipid metabolism.
Pink and green boxes represent enhanced and attenuated gene expression, respectively. Yellow and blue double squares represent increased and decreased metabolites, respectively. Accelerated and decelerated metabolic pathways are represented as bold and dashed arrow, respectively.

