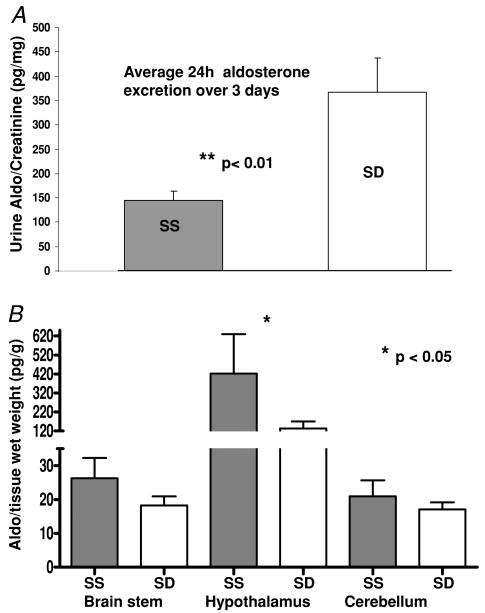
Figure 3. Average total aldosterone production and content in brain.
A, average 24 h urine excretion of the 9 pairs of SS and 8 pairs of SD rats collected over 3 consecutive days (ratio of pg aldo (mg creatinine)−1 (24 h) −1). B, aldosterone concentration (expressed as pg (g wet tissue weight)−1) in brainstem, hypothalamus and cerebellum of SS and SD rats. Tissues were pooled from 3 animals; n = 8. Bars indicate s.e.m.; *P < 0.05, **P < 0.01.

