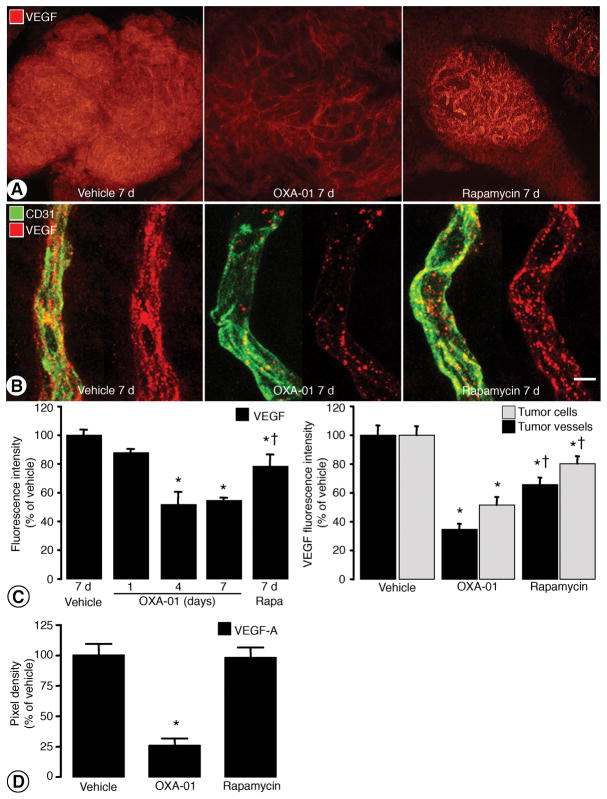
Figure 4. VEGF immunoreactivity with mTORC1/mTORC2 inhibition.
A. Fluorescent images of RIP-Tag2 tumors stained for VEGF after 7-day treatment with vehicle, OXA-01, or rapamycin. B. High magnification confocal images of RIP-Tag2 tumor vessels (CD31; green) with associated VEGF (red) after treatment. C. Quantification of VEGF fluorescence intensity in the overall tumor (left) and within tumor cells versus tumor vessels (right). D. Pixel density of VEGF in RIP-Tag2 tumors treated with vehicle, OXA-01 or rapamycin detected with antibody arrays. Scale bar in B represents 100μm in A; 6μm in B. *P< 0.05 vs. vehicle. †P<0.05 vs. OXA-01.

