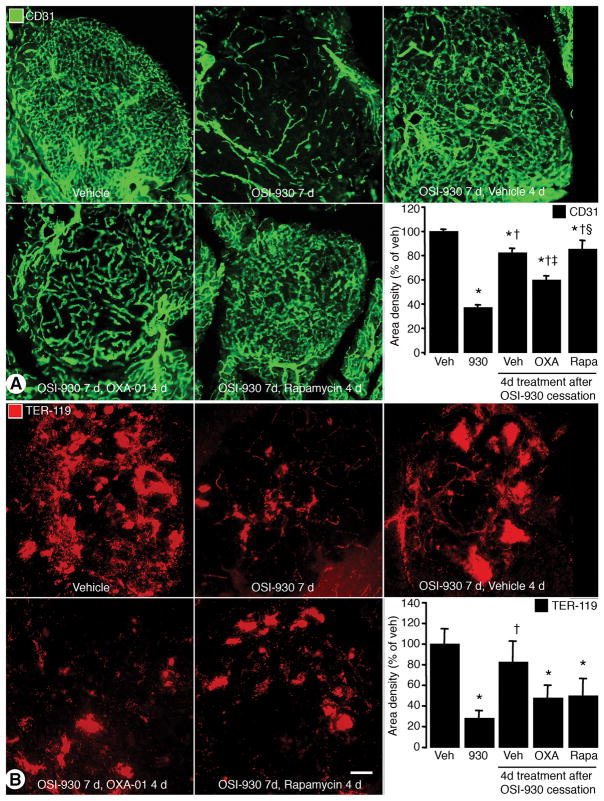
Figure 6. Effects of mTOR inhibition after cessation of VEGFR inhibition.
A. Confocal images of tumor blood vessels (CD31; green) and quantification of CD31 area density are shown. B. Confocal images and quantification of the erythrocyte marker, TER-119 (red). Scale bar in B represents 100μm in A and B. *P<0.05 vs. vehicle. †P<0.05 vs. OSI-930. ‡P<0.05 vs. OSI-930 7d, Vehicle 4d. §P<0.05 vs. OSI-930 7d, OXA-01 4d.

