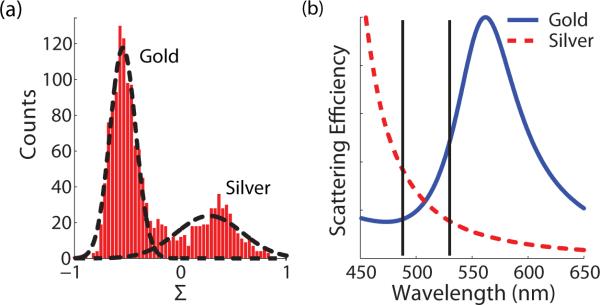
Figure 3.
(a) Histogram of the material-specific signal, Σ, clearly showing the existence of two different materials in the mixture. The dotted lines represent a bimodal Gaussian fit to the data. (b) Theoretical scattering efficiencies for 80 nm gold (solid) and 60 nm silver (dashed) spheres immersed in water. The solid vertical lines indicate the two wavelengths used in the experiment.

