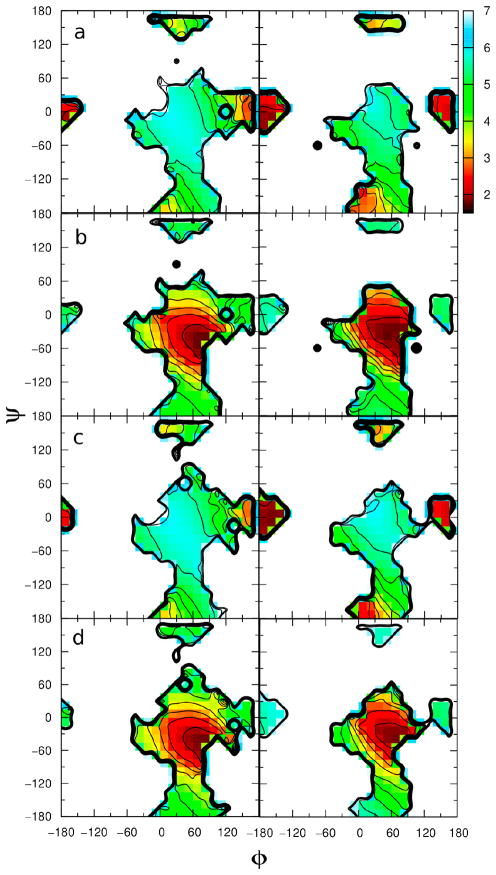
Figure 12.
2-D plots of average distance versus φ and ψ dihedrals in the aqueous phase (left) and the gas phase (right). Plots for methyl α-cellobioside of the average a) rHO2′,O3 and b) rO5′,HO3 distances and for β-cellobioside of the average c) rHO2′,O3 and d) rO5′,HO3 distances. φ/ψ given in degrees and distances given in Å.

