
Figure 3.
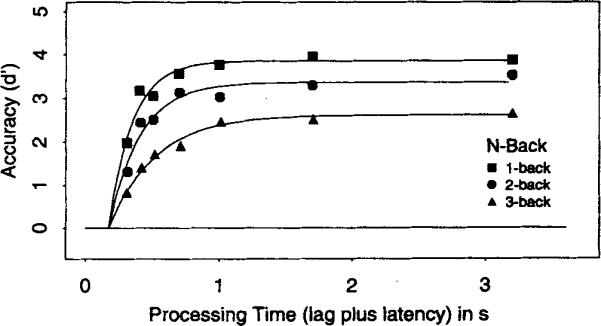
Average d′ accuracy (symbols) as a function of processing time (lag of the response cue plus latency to respond to the cue) for the 1-back, 2-back, and 3-back conditions in Experiment 1. Smooth curves show the best fits of Equation 1 with the (average) parameters listed in Table 1.