
Figure A1.
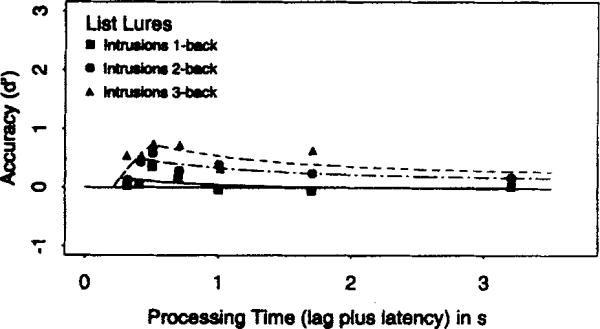
Average scaling of the false-alarm rates for 1-back, 2-back, and 3-back list lures as a function of processing time (lag of the response cue plus latency to respond to the cue) in Experiment 1. Smooth curves show the best fits of the dual-process model (Equation A1).