
Figure 7.
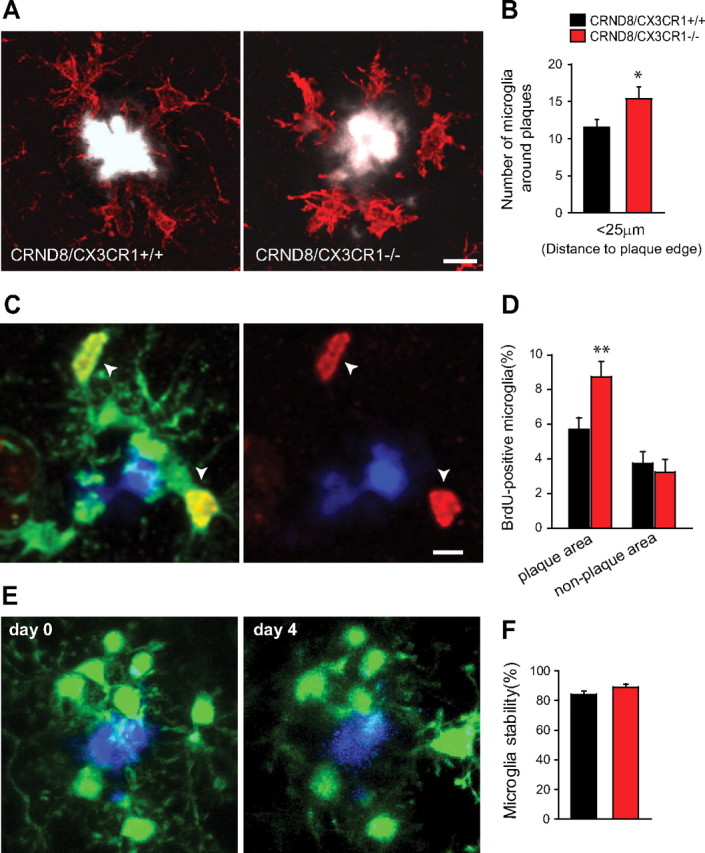
Microglia are more abundant around plaques in CX3CR1-deficient mice because of increased proliferation. A, Confocal images show greater number of IBA1-labeled microglia (red) around plaques of similar size (white) in 5-month-old CRND8/CX3CR1−/− mice than in wild-type littermate. Scale bar, 10 μm. B, Quantification of microglia cell bodies within a 25 μm radius of the plaque edge shows a greater number in CRND8/CX3CR1−/− mice than wild-type littermates (*p < 0.05, two-tailed Student's t test; n = 5 animals per genotype; values are expressed as mean ± SEM). C, Confocal image shows several BrdU-labeled (white arrows) IBA1-immunoreactive microglia (green) around an amyloid plaque (blue). Scale bar, 10 μm. D, The proportion of BrdU-labeled microglia within a 25 μm radius from plaques was significantly greater in CRND8/CX3CR1−/− than wild-type littermates (p < 0.01, two-tailed Student's t test; n = 300 and 329 plaques from 3 mice per genotype). There was no significant difference in the percentage of BrdU-labeled microglia in areas distant from plaques (p = 0.64, two-tailed Student's t test; n = 3 mice and ∼1500 microglia per genotype). E, Time-lapse two-photon image of microglia (green) and a methoxy-XO4-labeled amyloid plaque (blue) over a 4 d interval. The majority of microglia in the immediate vicinity of plaques appears stable. F, Quantification of changes in microglia number/position demonstrates no difference between CX3CR1 genotypes at least over this short time interval of 4 d (p = 0.11 for both groups, two-tailed t test; n = 6–7 mice and 67–69 plaques for CRND8/CX3CR1+/− and CRND8/CX3CR1−/−, respectively; values are expressed as mean ± SEM).