Fig. 8.
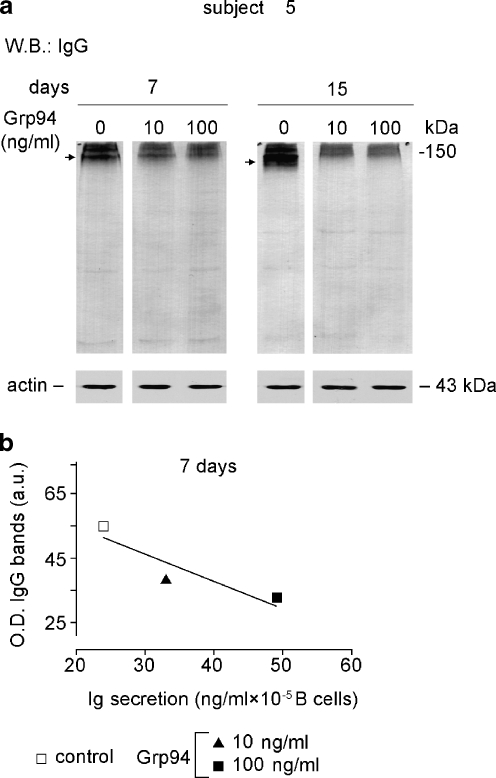
Time- and Grp94-dependent changes in the IgG content of PBMCs. The IgG expression in PBMC lysates was measured at the indicated time intervals in subjects 5, as specified in the “Materials and methods”. a Western blotting with anti-human IgG (H&L) polyclonal Abs following SDS-PAGE (10% acrylamide gel) in which samples were loaded in non-reducing conditions. Arrows on the left mark bands that show differences in lanes on right. Blotting of β-actin made on the same samples is reported below as control for protein loading. b Cumulative measurement of the intensity of IgG bands in each lane was performed with densitometric analysis and, at each incubation time, values of cumulative optical density (O.D.) plotted against the corresponding concentrations of secreted Igs. The linear regression analysis was applied for establishing the goodness of fit among points and deviation of the curve from zero (GraphPad Prism 3). The correlation coefficient (r2) was 0.82

