
Figure 2.
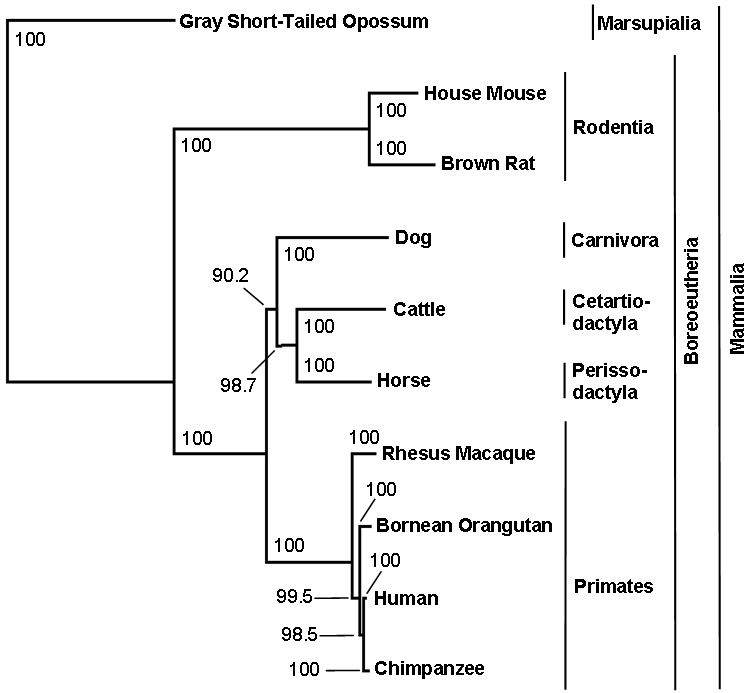
Phylogenetic tree of the intronic DNA (intron3) sequence of CTNNBL1. Different taxa are represented by nodes and their evolutionary relationships are represented by branches. Bootstrap values indicate how reliable a clade is. All tested introns gave similar phylogenetic trees as intron 3, exem-plarily shown here.