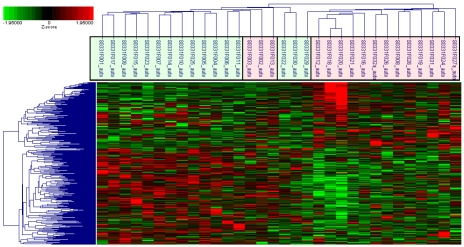
Figure 1.
Hierarchical clustering of participants and differentially expressed genes. Probes (N=356) representing differentially expressed genes (N=247) (upregulated: shades of red and downregulated: shades of green) (rows) and participants (columns, cases=pink and controls=green) grouped according to level and nature of expression and similarity of expression profiles (participants) and subjected to hierarchical tree clustering.

