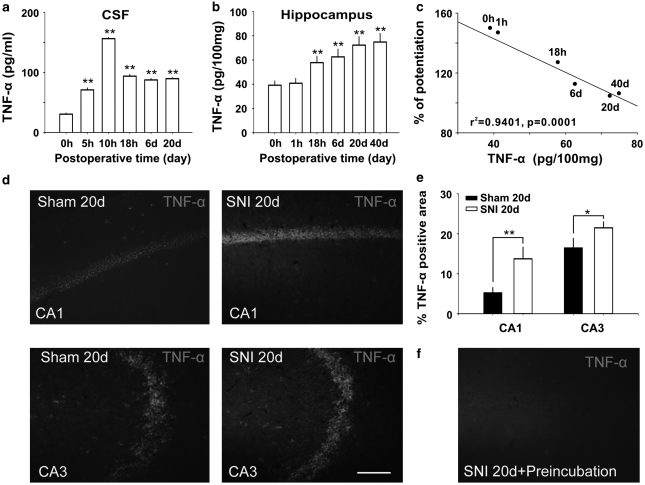
Figure 4.
SNI increases TNF-α in cerebrospinal fluid and hippocampal tissue and the concentration of TNF-α in hippocampus is correlated with LTP inhibition. (a and b) The concentrations of TNF-α in cerebrospinal fluid (CSF) and in hippocampal tissue at different time points following SNI (n=5 at each time point). (c) The correlation analysis between the amplitude of fEPSPs recorded at 30 min after HFS and the concentrations of TNF-α in hippocampal tissue at different time points following SNI (n=5–20 at each time point). **P<0.01 compared with the time point of 0 h after SNI. (d) Representative experiments showed the difference in TNF-α-IR area in CA1 and CA3 between sham operated and SNI rats. (e) The histogram showed the summary data (n=6) of TNF-α-IR-positive staining area in CA1 and CA3 in sham and SNI groups. (f) Identification of specificity of anti-TNF-α used in this study. The TNF-α-IR was clearly decreased in serial sections by preincubating anti-TNF-α antibody with TNF-α. Scale bar=50 μm. *P<0.05, **P<0.01 vs sham groups. Data are presented as means±SEM.

