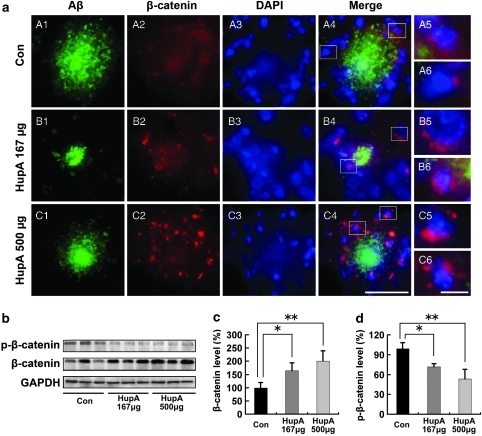
Figure 6.
Nasal gel HupA enhances the level of β-catenin in APP/PS1 mouse brain. (a) Confocal microscopic images showing the distribution of β-catenin in the HupA-treated transgenic mouse brain with double immunofluorescent staining of Aβ (A1, B1, and C1) and β-catenin (A2, B2, and C2). Counterstaining of DAPI was used to show the nucleus (A3, B3, and C3). At the merged images from the three channels, it was evident that the β-catenin immunoproducts were located around the Aβ-positive neuritic plaques (A4, B4, and C4), and that the β-catenin immunofluorescence was mainly located in the neuronal cell bodies (A5, A6, B5, B6, C5, and C6). Figure B5 shows a typical neuron with a large nucleus and containing intense β-catenin immunofluorescence in the cell body. In the vehicle-treated control mouse brain, the density of β-catenin immunofluorescence was very weak (A2), whereas it was very intense in the HupA-treated transgenic mouse brain (B2 and C2). Scale bar=50 μm (C4) and 10 μm (C6). (b) Protein levels of β-catenin and p-β-catenin (Ser33/37/Thr41) were examined by western blot in the brain of transgenic mice. GAPDH was used as an internal control. (c, d) Analysis results showed that the protein levels of total β-catenin were markedly increased (c), whereas the levels of p-β-catenin were significantly decreased in HupA-treated mice compared with controls (d). All values are mean±SEM (n=6). *p<0.05, **p<0.01.

