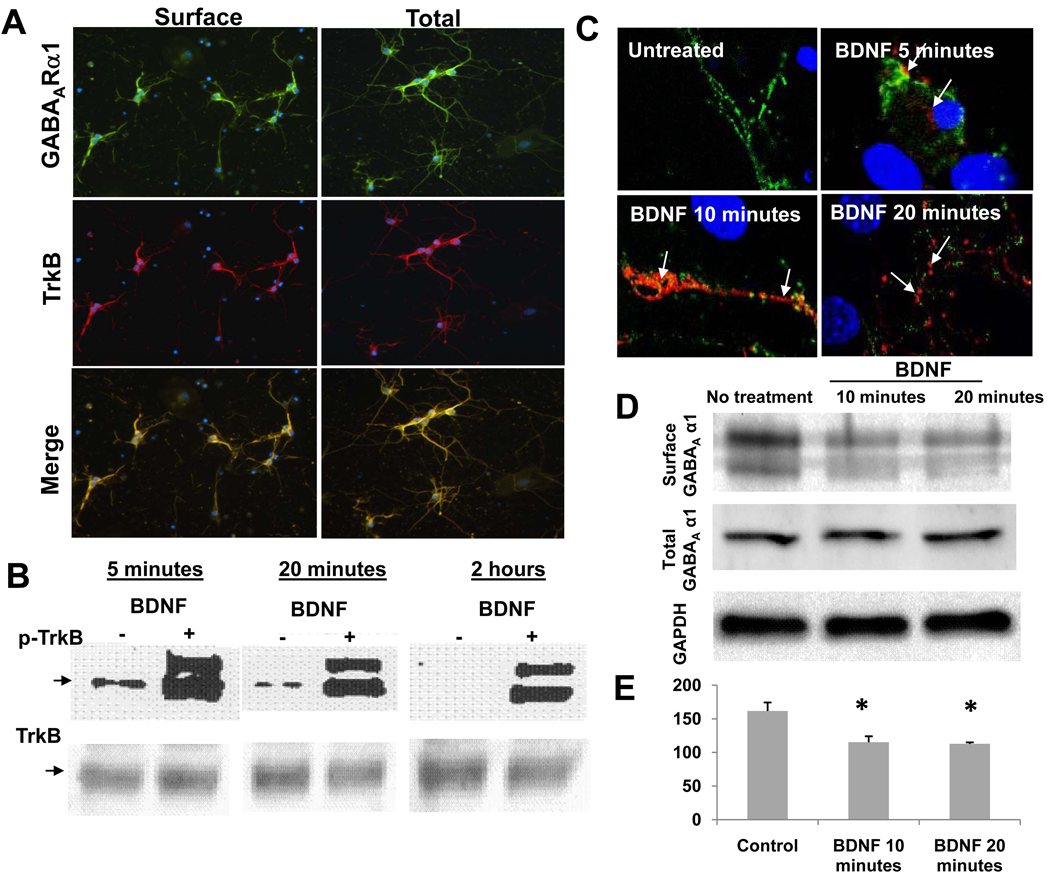
Figure 2. TrkB activation, co-localization with GABAARα1, and GABAARα1 internalization.
Panel A: surface (left) or total (right) GABAARα1 expression (green), TrkB expression (red), or the merge between the two (yellow). Panel B: an immunoblot, with phospho-TrkB (top, arrow is p-TrkB) and total TrkB (bottom), with vehicle vs. BDNF treatment at 5 min, 20min, and 2hrs after BDNF addition. Panel C: Confocal microscopy analysis of surface (green) and internalized (red) GABAARα1 subunits. Untreated neurons have abundant surface, but undetectable internal GABAARα1. BDNF (5, 10, or 20 minutes) treated cultures show internalized alpha 1 (red) in neuronal soma (5 min) and dendrites (10 and 20 min) after BDNF treatment. Arrows indicate internalized GABAARα1 subunits. Panel D: Biotinylation studies showing that the apparent internalization of GABAARα1 seen with antibody feeding techniques is confirmed with biochemical analyses of surface receptor localization. Western blot analyses is shown of biotin-precipitated, surface GABAARα1, total GABAARα1 from cell homogenate, and total GADPH as a loading control. Panel E: Quantification of surface:total GABAARα1 ratio following vehicle (control) or 10–20 minutes of BDNF treatment using the biotinylation surface-labeling technique. (Mean ± SEM, * p < 0.01, relative to control).

